The Alarm view window provides a means of viewing, acknowledging and correcting alarms that have been logged to the alarm database. Alarms can be arranged by column and filtered by acknowledged, corrected, severity settings etc.
Depending on the node selected in the Hardware or Service section of the Navigation Tree, the Alarm view window will tailor the display to show only the information that is pertinent for that device or service.
An alarm is defined as a SNMP trap event that has been generated by a hardware device. Alarms can occur for various reasons and may be generated by conditions such as video not present on the hardware device or the audio channel broadcasting over a pre-determined level. The alarm or fault TRAP will be sent from the hardware device to the VistaLink PRO Server (trap destination) which will indicate fault states to the operator by color keying nodes in the Navigation Tree.
VistaLINK™ PRO provides centralized alarm management. Incoming alarm events are processed and logged by the VistaLINK™ PRO Server and then dispatched to all VistaLINK™ PRO Clients connected to the server. When the VistaLINK™ PRO Client receives a dispatched alarm event it first determines the alarm's severity setting and then broadcasts the alarm to the Navigation Tree where the alarm is displayed to the operator.
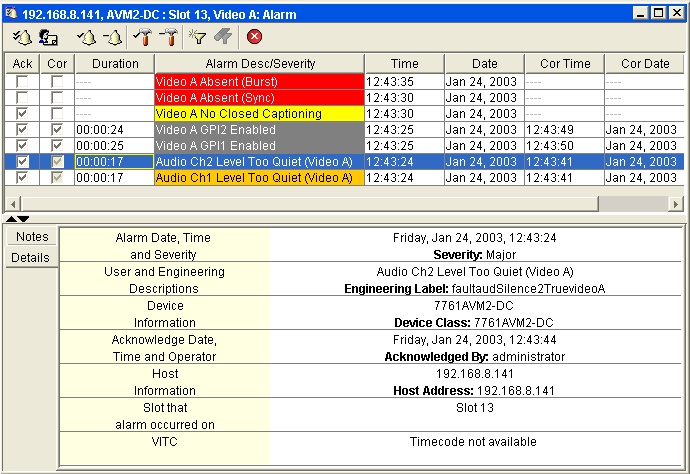
The Alarm View window is comprised of 3 primary areas:
The status area at the top of the window displays the Navigation Tree node selected for display, toolbar icons and the current filter settings.
The alarm content area in the middle of the window displays the individual alarm events for that node that are in the active alarm database.
The “Notes” and “Details” panel at the bottom of the window shows extended information about a selected alarm. See “Acknowledging and Correcting Alarms” for more information.
Individual alarms are viewed using the Alarm View Window. An Alarm View Window can be opened for any node on the tree in the Hardware or Service super-node sections. The node that is selected by the user will determine what alarm information will be displayed once the Alarm View Window is opened. Below is a description of the various types of nodes that can be opened:
Note:
There is
no limit to the number of Alarm View
Windows that can be open simultaneously. Each
time the user makes a new selection in the Navigation
Tree and launches the Alarm View a new Alarm
View Window will open displaying alarm information for the selected
node. The
"Window" menu found
on the menu bar provides options for configuring multiple open windows
such as the ability to cascade or tile the windows. This
menu also provides the ability to minimize, restore and close multiple
windows simultaneously.
 Hardware
Super-node
Hardware
Super-node
Opening an alarm view from the Hardware super-node will display all alarm events in the alarm database (alarm information for all hardware currently in the Navigation Tree) including current alarm events as well as alarm events that have occurred under the following conditions:
Hardware that has generated alarms but are longer connected to the network.
Hardware that has generated alarms but have had their IP addresses changed.
This also includes notes from any of the below mentioned node types.
 Frame Node
Opening this node will only display alarm events that have occurred for all products in the selected frame.
Includes alarm events for products that were previously in one slot but have since been moved to a different slot. This also includes products that were in the frame at one time but are no longer present in the frame.
 Product Node
Opening an alarm view from this node will only display alarm events that have occurred for the selected product.
 Product Video Input Node
Opening an alarm view from this node will only display alarm events that have occurred for the selected video input.
To open an alarm view window use one of
the following methods after selecting a node in the Navigation Tree (node
selected will determine alarms displayed as stated above)
Select Alarm -> View Alarm from the main
menu.
Click the Open Alarm View toolbar
button -  .
.
Right click the selected node and choose View Alarm from the pop-up menu.
Each alarm in the alarm view has two distinct operator states. The first state, acknowledged, indicates that the operator has seen the alarm condition and has dispatched a request to correct the problem. The second state, corrected, indicates that the alarm condition has been corrected either by intervention of an engineer or the source of the problem has restored itself. By utilizing these two alarm states it is possible to give an accurate representation of the whole network system by keying alarm states in the Hardware or Service views with various colors, and steady or flashing states.
The following table shows the acknowledged and corrected state and the visual indication that will occur.
|
Acknowledged |
Corrected |
Visual Alarm Indication |
|
No |
No |
Flashing, in assigned severity color |
|
Yes |
No |
Steady, in assigned severity color |
|
No |
Yes |
Flashing green - this state indicates that an alarm occurred and corrected itself before an operator acknowledged the error condition. This is the lowest priority alarm state. See Corrected but not acknowledged condition below. |
|
Yes |
Yes |
No alarm indication |
Corrected but not acknowledged
This is the lowest priority alarm condition. This means that if there is more than one alarm event for the same product then Flashing and Steady alarm conditions will be displayed before Flashing green alarm conditions. In other words, alarms that are not corrected, or alarms that have been acknowledged and not corrected, will generate operator alerts first.
VistaLINK PRO will report all alarm information from enabled devices including alarm conditions that have corrected themselves without user intervention (E.g. Momentary loss of video). If the alarm generated to the system has corrected itself, VistaLINK PRO will place a check in the corrected column check box for the particular alarm event and make that column check box unavailable. The system makes this column unavailable in order to indicate to the user that the alarm situation has returned to normal on its own as opposed to an alarm entry that has been corrected by a user manually checking the corrected column check box.
The Alarm view window provides a single click action to acknowledge all alarms presently in the view. Alarms that are already acknowledged when this action is performed will not be processed therefore the date and time stamps on those alarms will not be updated.
To acknowledge all alarms in the view, click
on the  button located in the bottom-right corner of
the alarm view window. Single this action may take some time to
complete you will be prompted to confirm the operation. Select Yes
to continue or No to abort the action.
button located in the bottom-right corner of
the alarm view window. Single this action may take some time to
complete you will be prompted to confirm the operation. Select Yes
to continue or No to abort the action.
Each VistaLINK™ PRO Client installation can customize which headings are displayed when the alarm view is opened for the various nodes of the Hardware and Service sections of the Navigation Tree. To open the customization dialog, select Alarm -> Configure Alarm Views.. The Configure Alarm Views dialog box will appear.
The Configure Alarm Views dialog is comprised of a View Category selector, Available Fields area and the Show fields in this Order section. The view category selects the corresponding node in the Hardware view that you want to customize the view for. The available fields category contains fields (otherwise known as headers) that have not been added to the view and the Show Fields in this Order category shows the fields that have been added to the view. The top-to-bottom order in which the fields appear in the Show Fields in this Order category determines the left-to-right order that the fields will appear in the alarm view window, respectively.
The order of the fields can be changed by selecting one or more fields on the right and selecting to move the fields up in the order or down in the order by clicking on the Up or Down buttons.
Fields can be added or removed by selecting the field of choice then selecting the available Add or Remove button.
Once complete, click on the "OK" button to save your changes. Any open alarm view windows will not update to the new customizations until closed and re-opened.
Note: Some of the Available Fields options will be specific to certain hardware modules. For example, the "Alarm GPI Label" which is populated by user defined labels set on each individual 7700GPI module (if present). or the OV Trap Tag field which is specific to a 3000OV MVP module.
Each alarm view window allows for the entry of additional
custom note alarm entries. These custom entries will appear in the
Alarm View Window, however, will
not be associated with a particular system event. To enter a custom
note click the  Add
Custom Note button located in the toolbar of the currently displayed
alarm view window.
Add
Custom Note button located in the toolbar of the currently displayed
alarm view window.
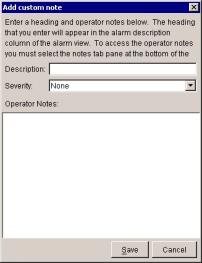
The Add Custom Note dialog box will open allowing the operator to enter a description for the custom note (displayed in the description column of the alarm view window), a severity setting and any extended operator notes that should be included with this entry. Click Save to add the Custom note to the alarm view window.
Normally when an alarm view is opened all alarm events for the selected node are shown. This may not be the desired functionality. VistaLINK™ PRO provides an option to display only alarms that match specified filter criteria. For example, the system can be set to filter out any alarm events that have been previously acknowledged or corrected thus only displaying the alarm events that have not been addressed.
In the event that new alarm are generated while a filter is enabled, the new events will be displayed in the alarm view only if the event passes the filter criteria.
A filter can be applied to an alarm view window in two different ways:
1. A Default Filter is established that will be applied to all alarm view windows each time they are opened.
To setup a Default Filter select Alarm -> Setup Default Filters... from the main menu. This will open the Filter Options dialog box allowing creation of the default filter (see Constructing Filters section for additional details). Select Data Field, Test Condition and Criteria, then “Save” filter. Upon reopening the alarm view, the default filter is applied.
2. A Custom Filter is applied to an open alarm view window that will apply to the alarms currently being displayed. However, when an alarm view window with a Custom Filter is closed and then reopened the filter will be removed and the display will return to the default view.

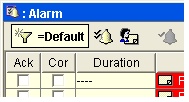
To setup a Custom Filter click the  Filter Alarms toolbar
button found at the top of the alarm view window. This will open
the Filter Options dialog box
allowing creation of the custom filter (see Constructing
Filters section for additional details).
Filter Alarms toolbar
button found at the top of the alarm view window. This will open
the Filter Options dialog box
allowing creation of the custom filter (see Constructing
Filters section for additional details).
Default and Custom filters are both created using the Filter Options dialog. This dialog allows the user the ability to establish a filter set that will limit which alarms are displayed in an alarm view window.
The Filter Options dialog box presents individual filter options (per row) that can be enabled or disabled in order to build the desired filter. Each filter option (row) has three columns that make up the filter option parts. Each filter option can be enabled or disabled as part of the final filter criteria by changing the Test Condition to any value other than “Disable this filter”. When the Test Condition column has been changed for a filter option, that option becomes active and is indicated active by displaying the rows background color in yellow.
Example: Changing the first Test Condition drop down box to “Is not” will establish a filter that will only display alarms where the Acknowledged Status (Data Field) Is not (Test Condition) Checked (Criteria) or simply, will only display alarms that are unacknowledged.
The user can enable as many filter options (rows) as necessary, in order to build the appropriate filter. When using more than one filter option the user has the ability to set each additional option as an AND option, meaning the alarm must meet all filter requirements (Option 1 AND Option 2), alternatively, additional options can be set as OR options, meaning the alarm will be shown if it meets any of the filter options (Option 1 OR Option 2). After all filter option selections have been made, clicking the Apply Filter button will activate the filter (Default or Custom depending on how the Filter Options dialog was accessed).
The Clear and Clear All buttons can be used to reset filter options back to a disabled state. Clear will reset only the selected row, while Clear All will reset all selected filter options.
Once a filter has been created, it can be saved for future use or copied to other clients. To save a created filter, click “Save Filter Set”. VistaLINK PRO will prompt for a name and location to save the filter set to. Saved filters can be loaded back into the Filter Options dialog by clicking “Load Filter Set” and then browsing to the saved filter and clicking “Open”.
With this filter applied, the alarm view window will only display alarms if they have neither been acknowledged nor corrected thus eliminating all alarms from the view that have been fully addressed. To load the Unresolved Alarm filter click Load Filter Set in the Filter Options dialog, browse to the VistaLinkProClient folder (C:\Program Files\VistaLinkProClient by default) and select the “Filter_UnresolvedAlarms.xml” file. This will load the default Unresolved Alarms filter into the Filter Options dialog enabling the first two rows. (Ack Status Is not Checked OR Cor Status Is not Checked).
While an alarm view window is open it may
be desirable to temporarily hold new alarms from interrupting the display
of existing alarms. In this case it is possible to suspend
the processing of alarm updates by clicking on the  Suspend
toolbar button in the top-right corner of the alarm view window.
The button will stay depressed and the alarm view will display the button
with a red background
Suspend
toolbar button in the top-right corner of the alarm view window.
The button will stay depressed and the alarm view will display the button
with a red background  to indicate that the alarm view
window is currently suspended.
to indicate that the alarm view
window is currently suspended.
While in this mode, the alarm view window will not receive any new alarm events. The alarm view will continue to update the status of any events in the view if the status changes.
To resume receiving new alarms, click on the Suspend button once again. The button will restore to its normal state and the alarm view will immediately catch up on any alarms that have occurred during the suspended period.
This feature allows you to save (or export) the alarms in the alarm view window to an external file. Any filter settings that are currently applied to the view will also be applied to the save operation. Note that any customizations to the headings will not be inherited by the save. All headings are saved when the current view is saved.
Saving to a new file:
Click the Save
Alarm log to disk  button on the toolbar.
A dialog box will appear asking for a location and filename for the new
alarm log file.
button on the toolbar.
A dialog box will appear asking for a location and filename for the new
alarm log file.
Select the desired location for the file and enter a filename in the file name area. If no extension to the filename is specified a .txt extension will be appended.
Appending to an existing file:
Follow the steps outlined in the “Saving to a new file” procedure above except specify the filename of an alarm log file that already exists on your system. You will then be prompted whether or not you wish to append to the end of this file. If you choose to append, the alarm information will be appended to the end of the specified file, separating existing information from new information with a single line header describing the date and time the new append occurred.